第8堂課
1 2 3 4 5 6 7 8 9 10 11 12 13 14 15 16 17 18 19 20 21 22 23 24 25 26 27 28 29 30 31 32 33 34 35 36 37 38 | # -*- coding: utf8 -*-
# 匯入視覺化套件
from vpython import *
# 1. 畫面設定
# 畫布
scene = canvas(center=vector(0, 0.3, 0), background=vector(0.5,0.6,0.5))
# 位置圖
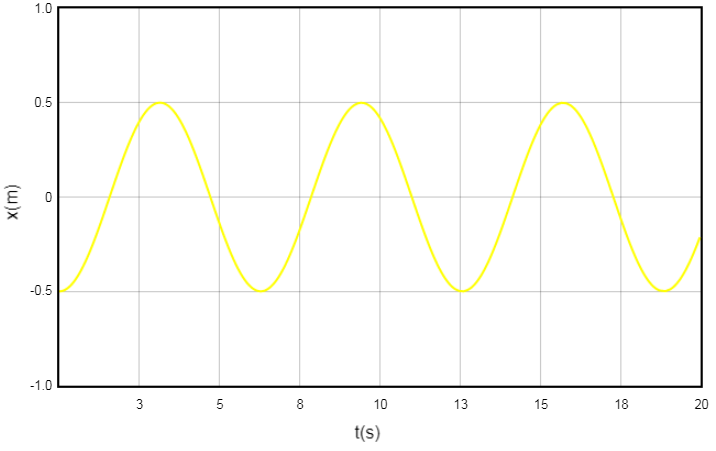
gd1 = graph(xtitle='t(s)', ytitle='x(m)', ymax=1, xmax=20, ymin=-1)
tx = gcurve(graph=gd1, color=color.yellow)
# 桌面
table = cylinder(pos=vector(0,-0.03,0), axis=vector(0,-0.01,0), radius=0.7, texture=textures.wood)
# 圓心
center = cylinder(pos=vector(0, -0.03, 0), axis=vector(0, 0.03, 0), radius = 0.007)
# 球
ball = sphere(pos=vector(-0.5,0,0), radius=0.03, color=color.blue)
# 2. 設定參數、初始值
ball.v = vector(0, 0, 0.5)
r = mag(ball.pos)
print("速度 = ", mag(ball.v))
print("時間週期 = ", 2*pi*r/ mag(ball.v))
# 時間間隔
dt = 0.001
# 經過時間
t = 0
# 3. 運動部分
while True:
rate(1000)
# 更新球的資料
ball.a = - (mag(ball.v)**2 / r) * (ball.pos/r)
ball.v = ball.v + ball.a*dt
ball.pos = ball.pos + ball.v*dt
# 畫出x軸位置圖
t = t + dt
tx.plot(pos=(t, ball.pos.x))
|
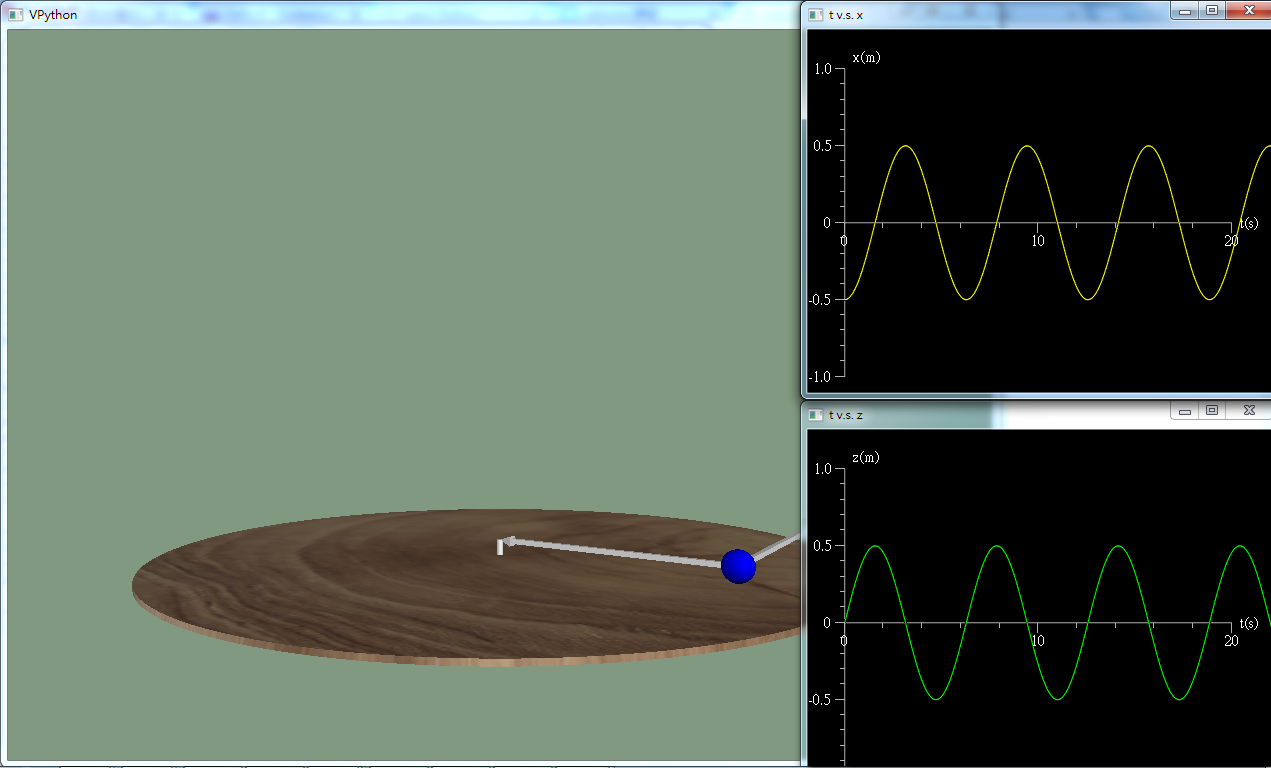
執行結果
作業
請畫出z軸的時間位置圖,如下圖。
本單元課程自2018.7.5日起已被瀏覽 430 次