第5堂課
畫出座標軸與標籤
1 2 3 4 5 6 7 8 9 10 11 12 13 14 15 16 17 18 19 20 | # -*- coding: utf8 -*-
# 匯入視覺化套件
from vpython import *
#畫布
scene = canvas(center=vector(0.2, 0.5, 0.5), width=1000, height=1000, background=vector(0.5,0.6,0.5))
# x軸箭頭
x_axis = arrow(axis=vector(1, 0, 0), shaftwidth=0.01)
# y軸箭頭
y_axis = arrow(axis=vector(0, 1, 0), shaftwidth=0.01)
# z軸箭頭
z_axis = arrow(axis=vector(0, 0, 1), shaftwidth=0.01)
# x軸標籤
label(pos=vector(1.1, 0, 0), text='x', box=False)
# y軸標籤
label(pos=vector(0, 1.1, 0), text='y', box=False)
# z軸標籤
label(pos=vector(0, 0, 1.1), text='z', box=False)
|
執行結果
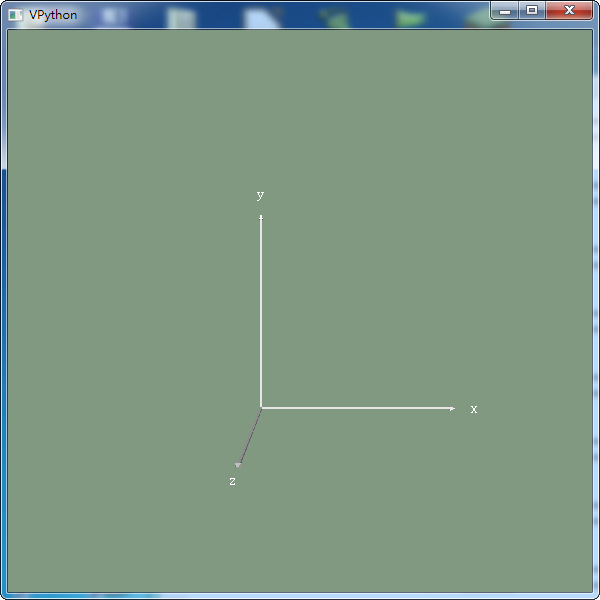
畫出向量及做加法運算
1 2 3 4 5 6 7 8 9 10 11 12 13 14 15 16 17 18 19 20 21 22 23 24 25 26 27 28 29 30 | # -*- coding: utf8 -*-
# 匯入視覺化套件
from vpython import *
#畫布
scene = canvas(center=vector(0.2, 0.5, 0.5), width=600, height=600, background=vector(0.5,0.6,0.5))
# x軸箭頭
x_axis = arrow(axis=vector(1, 0, 0), shaftwidth=0.01)
# y軸箭頭
y_axis = arrow(axis=vector(0, 1, 0), shaftwidth=0.01)
# z軸箭頭
z_axis = arrow(axis=vector(0, 0, 1), shaftwidth=0.01)
# x軸標籤
label(pos=vector(1.1, 0, 0), text='x', box=False)
# y軸標籤
label(pos=vector(0, 1.1, 0), text='y', box=False)
# z軸標籤
label(pos=vector(0, 0, 1.1), text='z', box=False)
#畫出二個向量
vector1 = vector(1.5, 0.5, 0)
arrow(axis=vector1, color=color.black, shaftwidth=0.02)
vector2 = vector(-1, 1, 0)
arrow(axis=vector2, color=color.black, shaftwidth=0.02)
#向量加法運算
final_vector = vector1 + vector2
arrow(axis=final_vector, color=color.red, shaftwidth=0.02)
|
執行結果
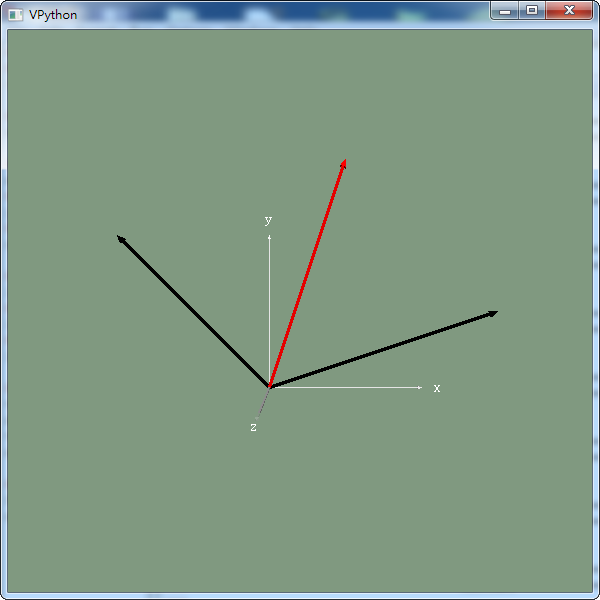
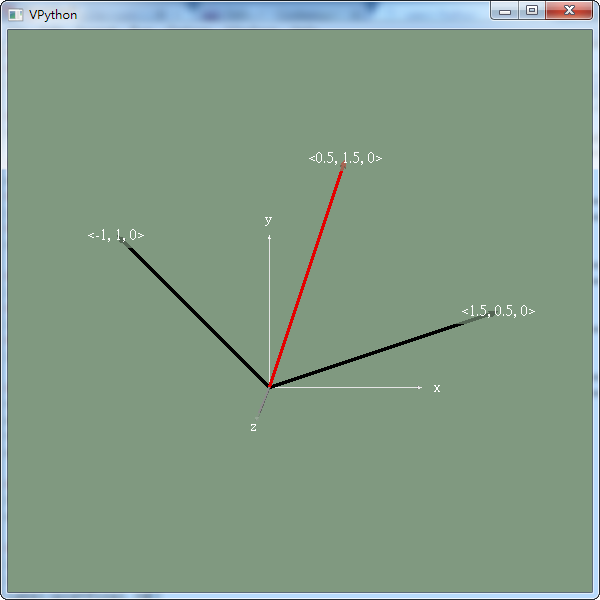
作業
請在上面的向量中,加入文字標籤顯示向量值,如下圖
提示:str(vector)可以將向量轉換成文字資料型態
本單元課程自2018.7.5日起已被瀏覽 546 次